Troubleshooting Your Job - using top and htop
If your job is terminating prematurely or taking longer than expected to complete, there are a couple of Linux commands that you can use to help diagnose the problem. These suggestions will require that some portion of your job is currently running, You'll have to log onto one of the compute nodes where your job is running and execute a Linux command to obtain information about your process(es) running on that node.
How to log onto the compute node
To find out which compute node(s) your job is running on, use the
LLstat command on one of the login nodes. You can find the names of
the compute nodes in the NODELIST(REASON) column.
Then log onto one of the compute nodes by issuing the ssh command:
$ ssh <compute-node-name>.mit.edu
Now you'll be logged onto a compute node where one or more of your processes is running. The following sections will help you gather more information about your running job.
If your job is terminating prematurely
One common reason jobs terminate prematurely is because the node runs
out of memory. We have instructions for checking the memory usage of a
completed job on the page Finding the Memory Requirements of My
Job. While your job is currently
running, you can use the Linux top command to monitor the memory that
your process(es) is using on a particular node.
Once you have logged onto the compute node, use the Linux top command
to see information about your process(es) running on that node. Although
there may be other processes belonging to other users also running on
the compute node, you'll see only your processes.
Below is a snippet of sample output from the top command. The output
is automatically refreshed every 3 seconds. You can click on the
screenshot to view a larger version, then use the browser's back arrow
to return to this page.
In the tasks section of the output (below the white line), you will see information about your individual processes. The RES column shows the physical memory used by each process, and the %MEM column shows the percentage of the total system RAM being used by each process. This will help you determine whether your process is using too much memory.
Enter 'q' (for quit) to return to the Linux shell prompt.

If your job is running slowly
If your job is taking much longer to run than you expect, one possible
explanation is that your processes may not be properly distributed
across the processors on the node. You can log onto the compute node and
use the Linux htop command to see how the load is distributed across
the processors on the node.
Once you have logged onto the compute node, use the Linux htop command
to see information about load distribution.
Below are some sample output screens from the htop command. The output
is automatically refreshed every 3 seconds. You can click on the
screenshot to view a larger version, then use the browser's back arrow
to return to this page.
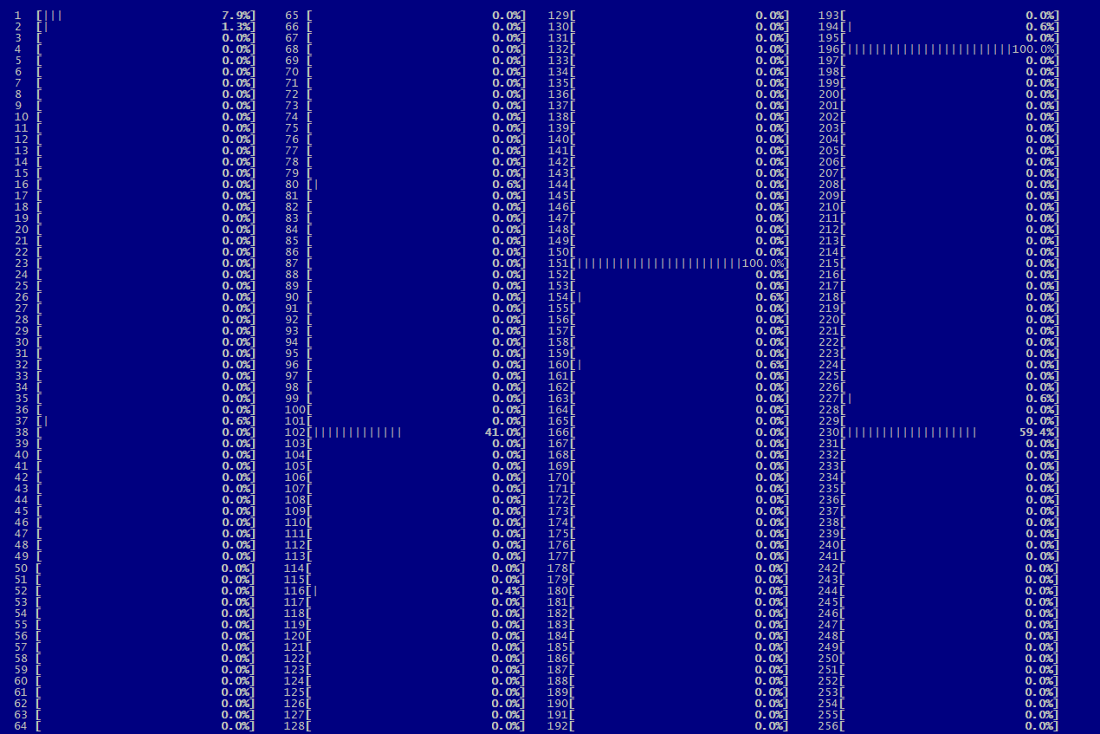
The htop output displays instantaneous cpu usage (specified as a
percentage) for each process. In the sample screenshots below, the
compute node that we're looking at has 256 processors, which are
numbered 1 - 256. The progress bar next to each process describes its
usage.
Beneath the cpu usage section, you'll see "Load average", a set of 3 values that represent the average system load for the last 1, 5 and 15 minute periods. Since these represent averages, load gives you a better idea of the overall work that is being done on the node.
In the screenshots below, we submitted a pMatlab job using Triples Mode to specify our resource request, which allows us to specify how we want the MATLAB® processes distributed. In this example, we specified [1 4 2], which means:
- we want to use 1 compute node
- we want to launch 4 MATLAB® processes per node
- we want to limit the number of OpenMP threads to 2
Enter 'q' (for quit) to return to the Linux shell prompt.
Well distributed processes
In this first htop screenshot, we see that our 4 MATLAB® processes are running on different processors.

Improperly distributed processes
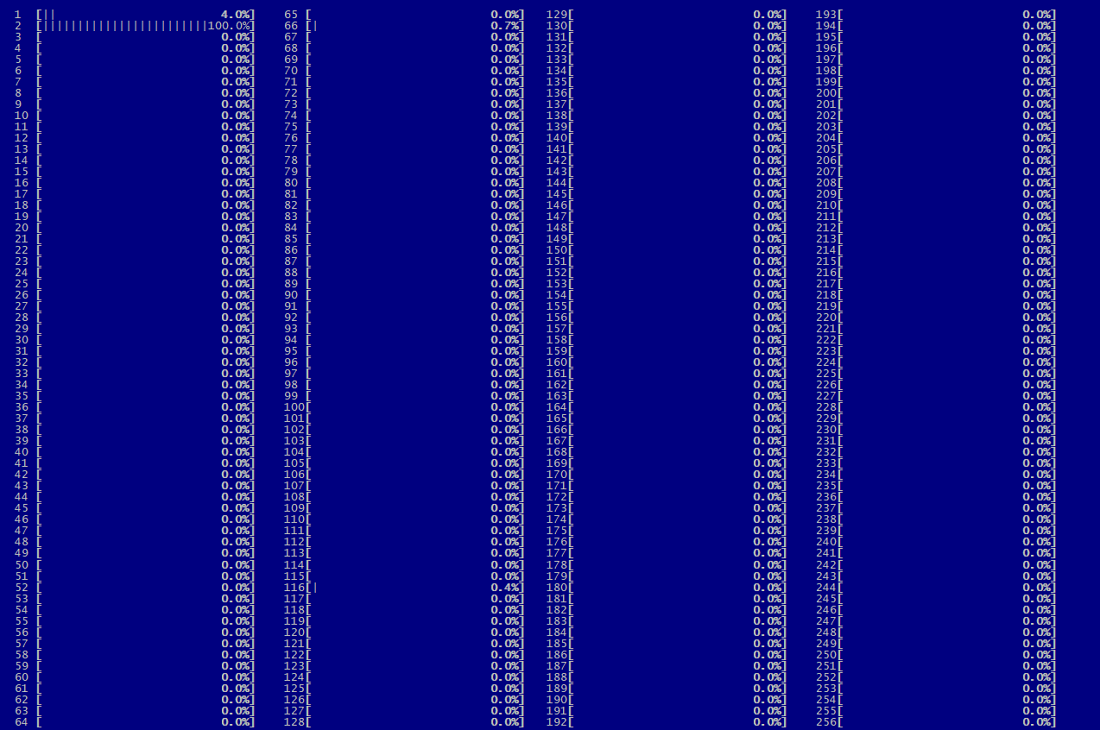
In this second htop screenshot, it looks like all of the work is being
performed by a single processor. If you monitor htop for a while and
see that only a single processor seems to be performing the work most of
the time, contact supercloud@mit.edu; we can
provide some recommendations on how to get the processes distributed
properly.
